Your Analytics Dashboard
Table of Contents
Insights: Analytics Dashboard
The Analytics Dashboard is the primary analytics interface within Levo Insights. It provides a high-level, real-time view of your site’s traffic, user behavior, and engagement patterns.
All data is collected securely through server-side tracking, ensuring accuracy and preventing interference from ad blockers. Additionally, bot traffic is automatically identified and excluded from key metrics, resulting in clean and reliable insights.
Access & Navigation
Open your workspace dashboard
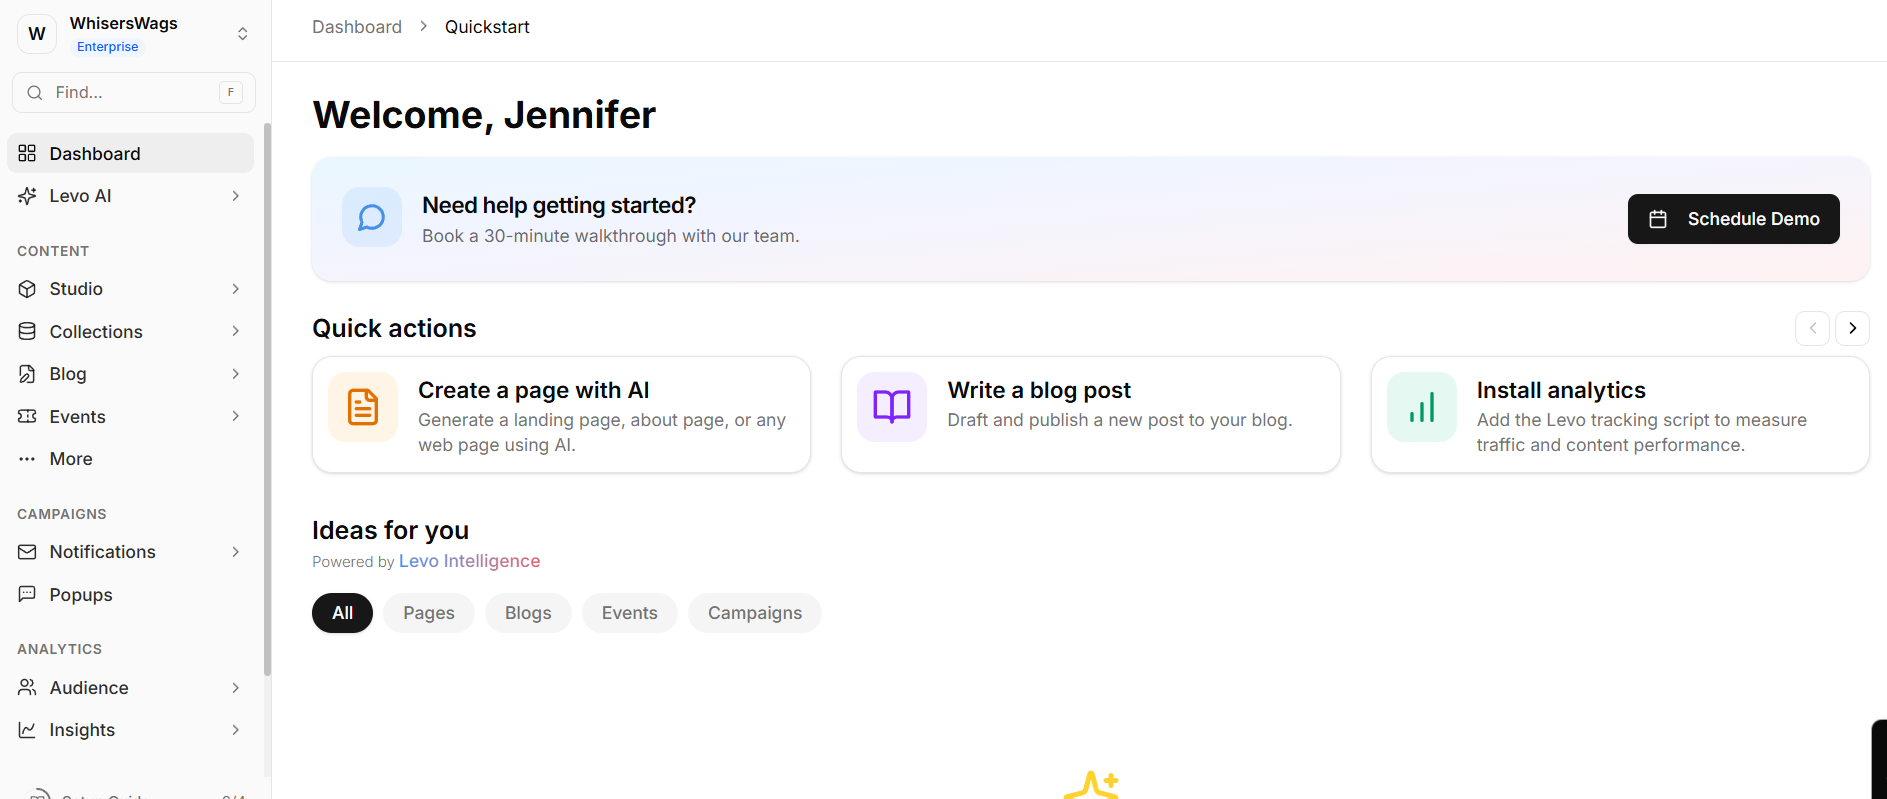
Use the left-hand navigation panel
Locate the Insights section
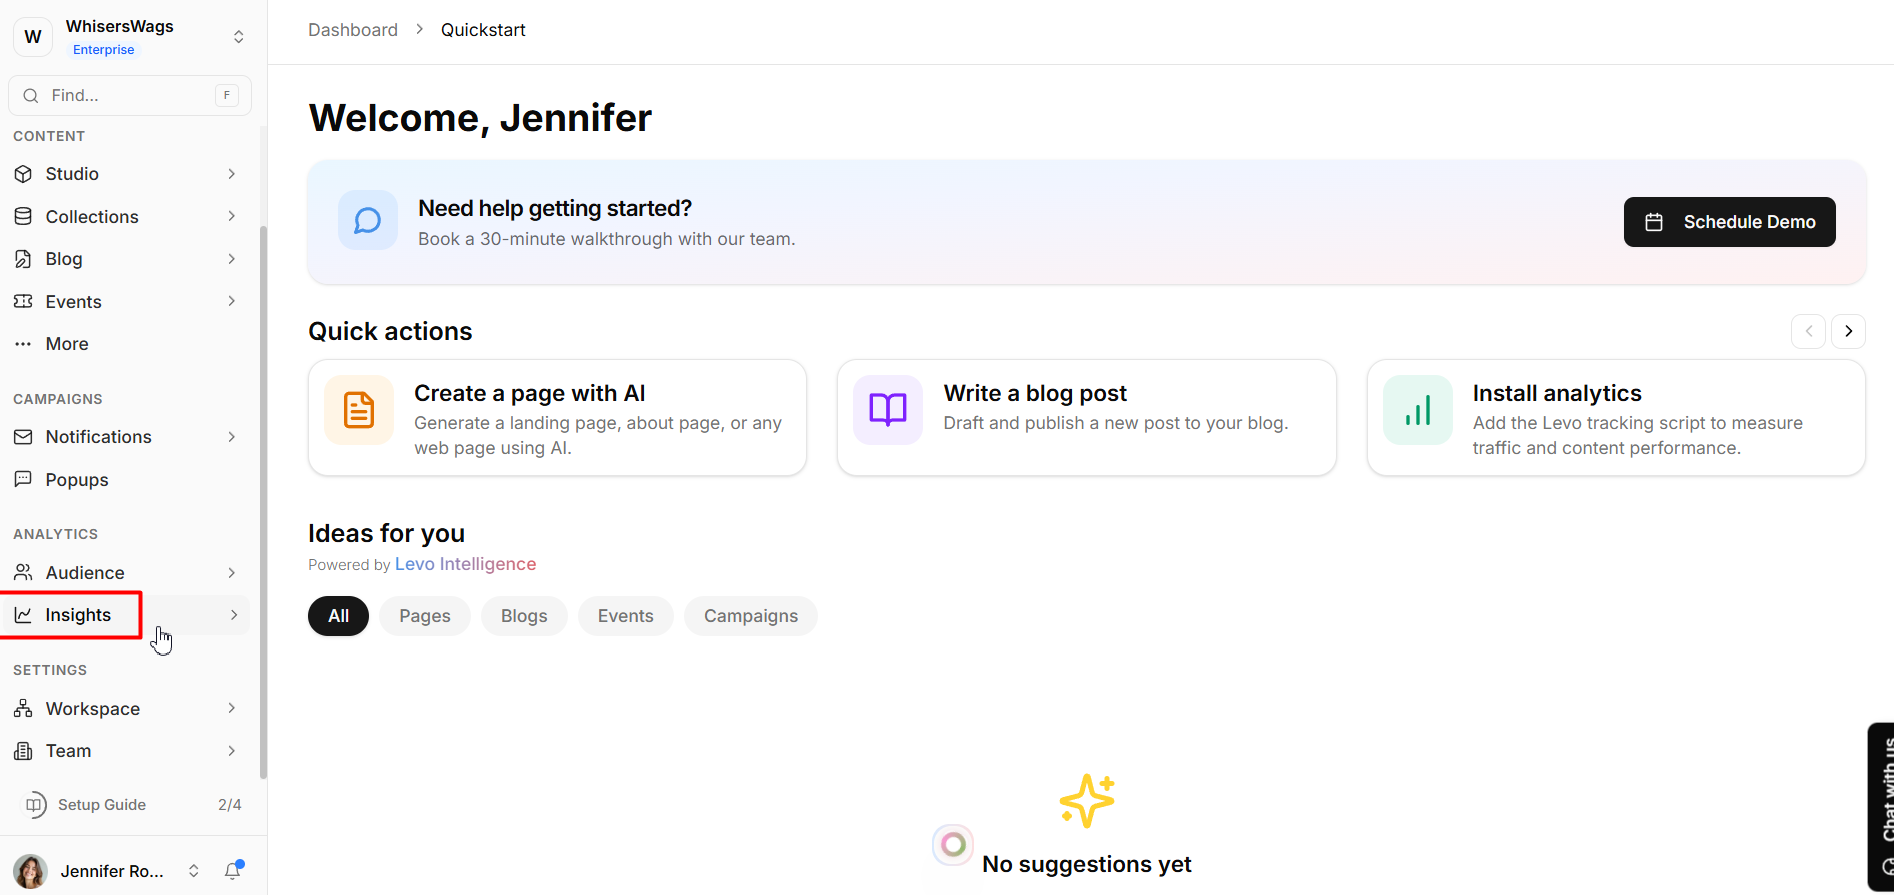
Select Overview from the available dashboards (Overview, Pages, Users, Visits)
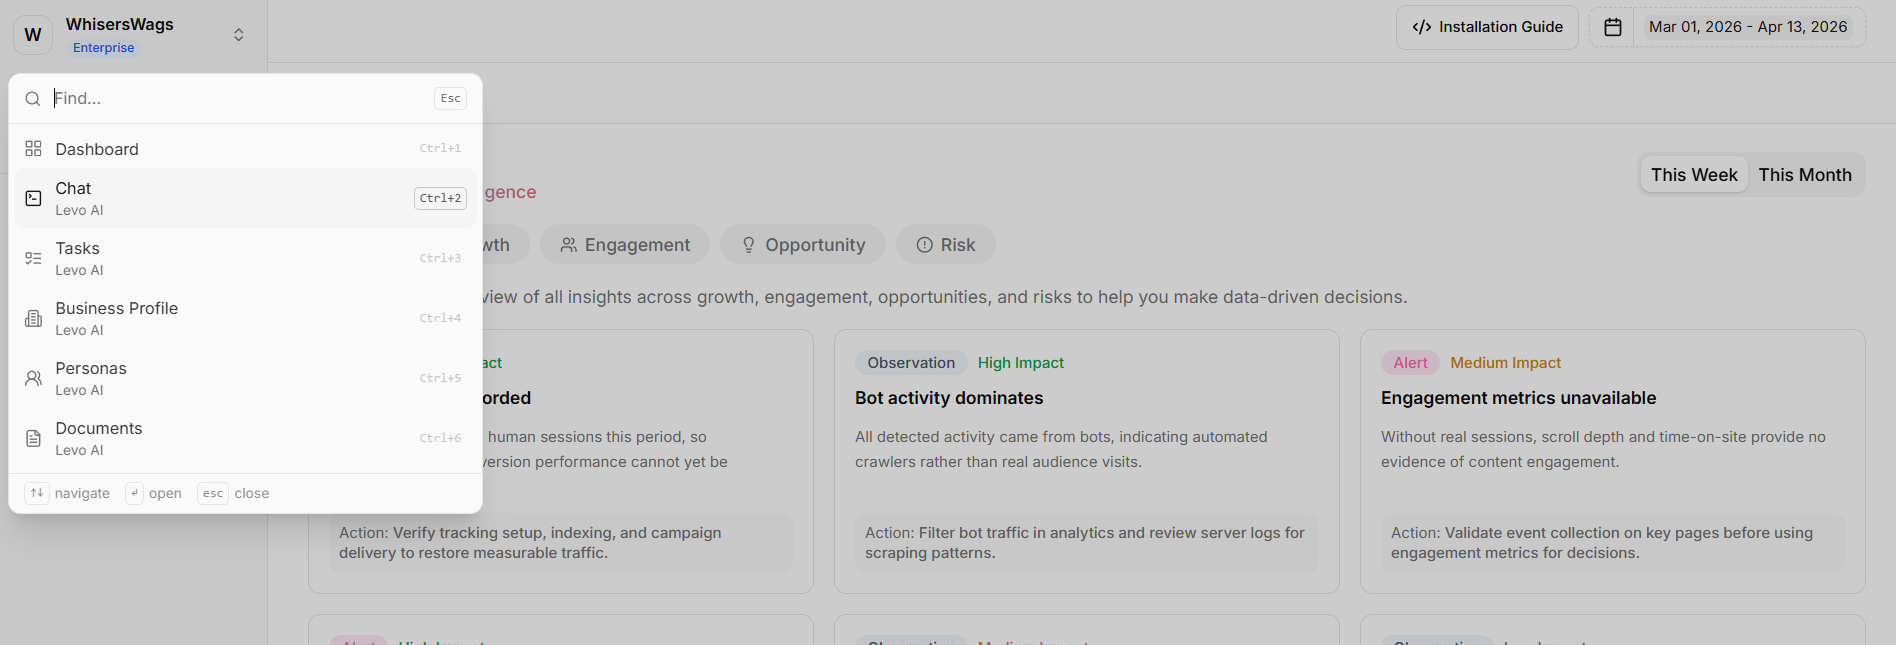
Quick Navigation Tip
Press F to focus the search bar and quickly jump to any section
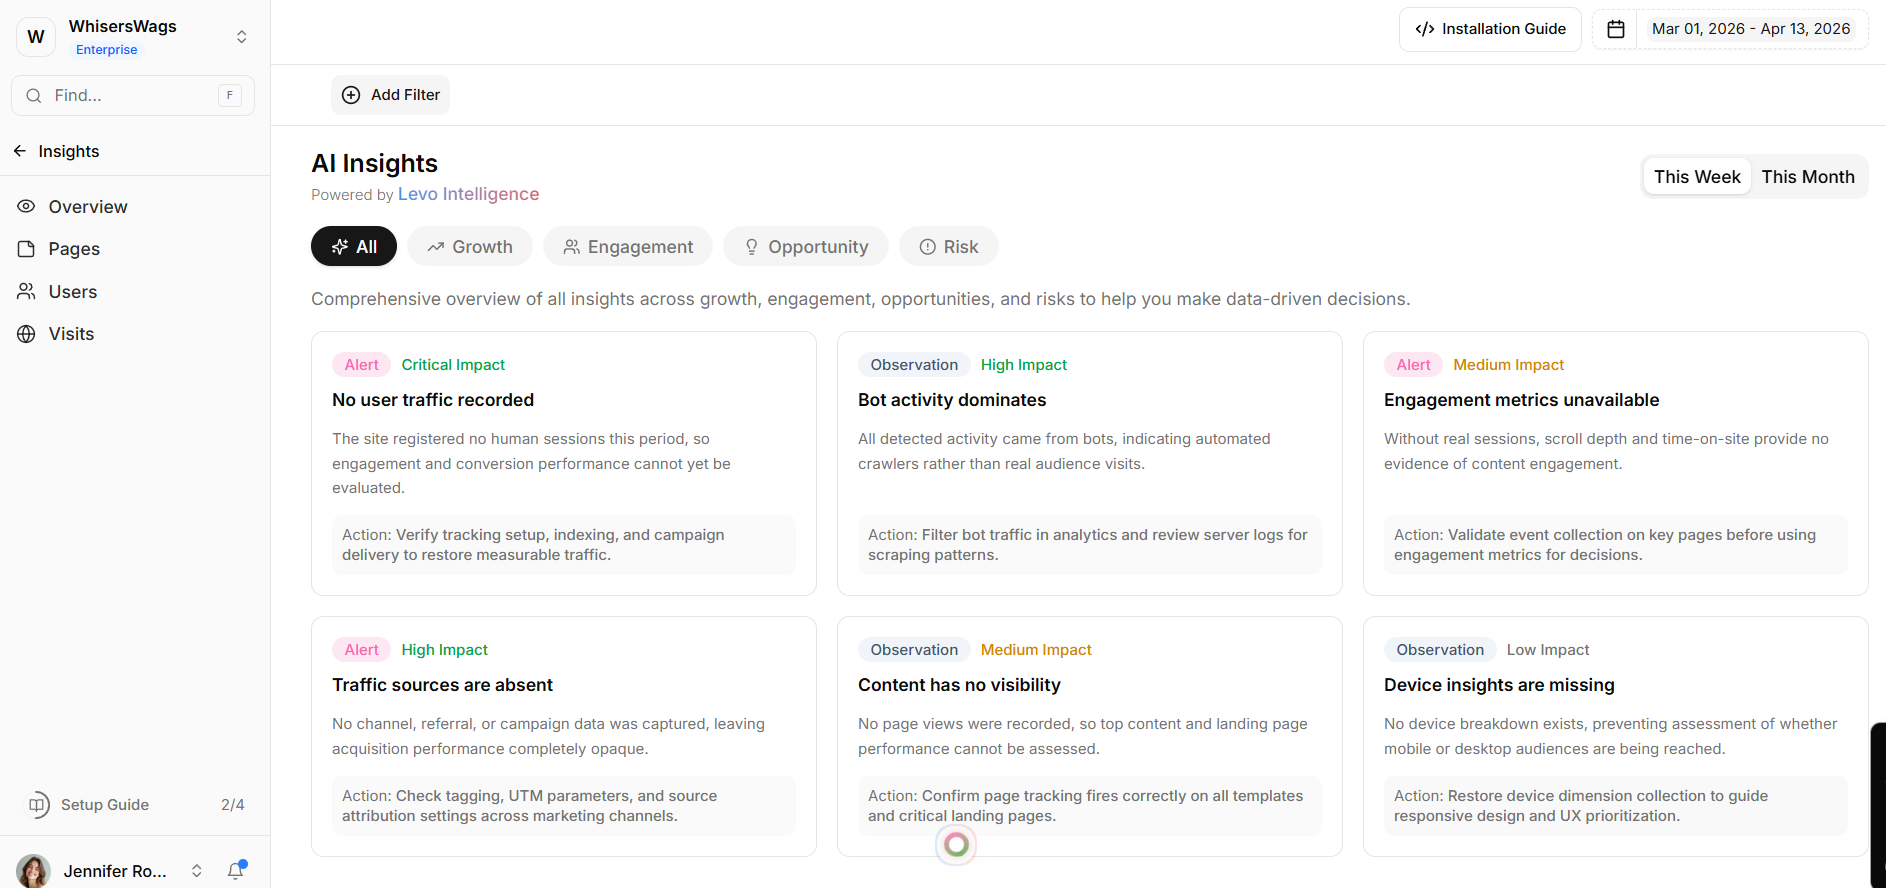
Global Dashboard Controls
These controls allow you to customize your analysis view:
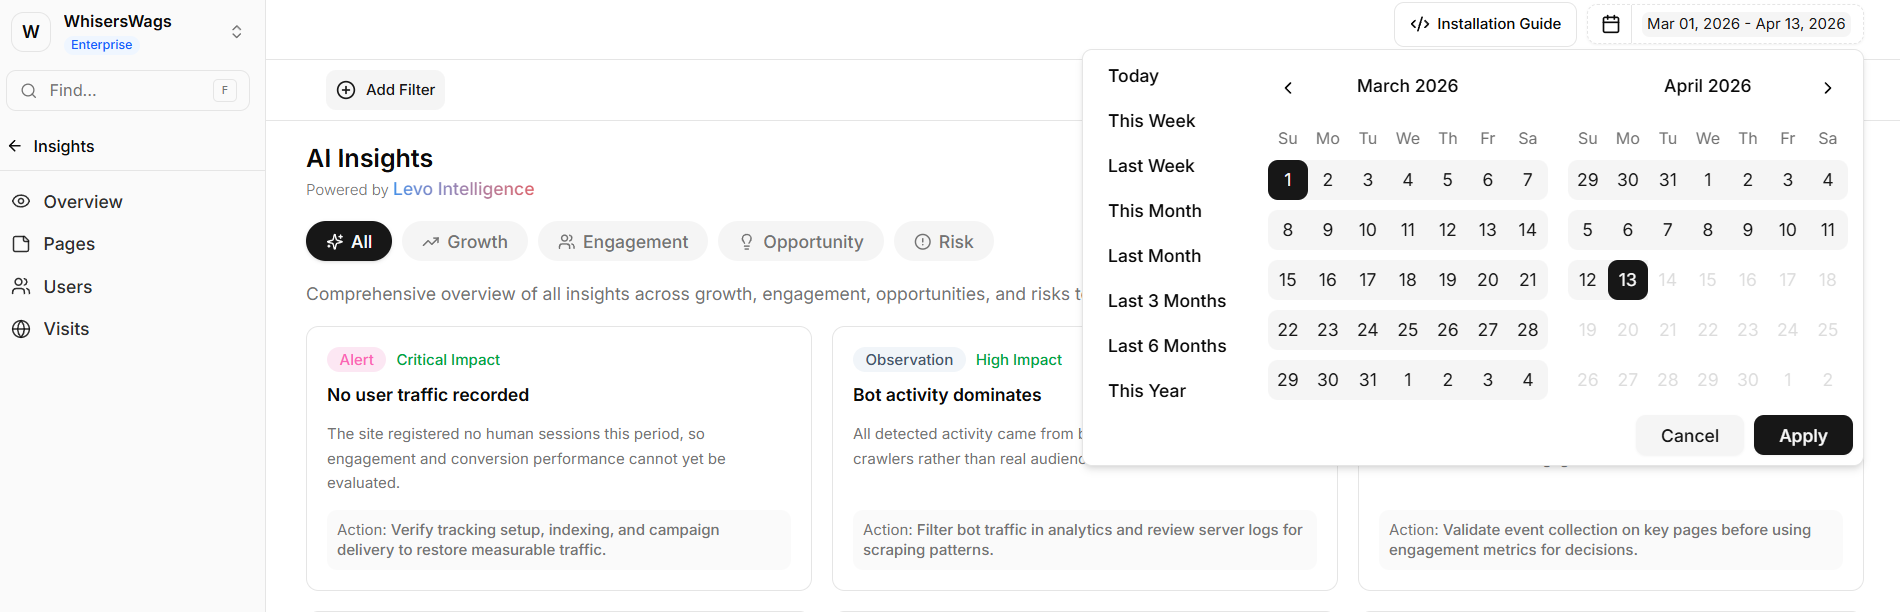
Date Range Selector
Choose preset ranges (e.g., 7 days to 3 months)
Or define a custom time period
Domain Filtering
View combined data across multiple domains
Or isolate analytics for a single site
Dimension Filters (Add Filter)
Filter the dashboard by:
Country
Browser
Device
Traffic source
Campaign parameters
Filters remain applied across the entire dashboard
Quick Filtering
Click on any value within a widget to instantly apply it as a filter
Core Stat Cards
Seven critical performance metrics sit prominently at the very top of your dashboard. They display the current period's total value alongside a percentage change versus the previous period to instantly highlight trends:
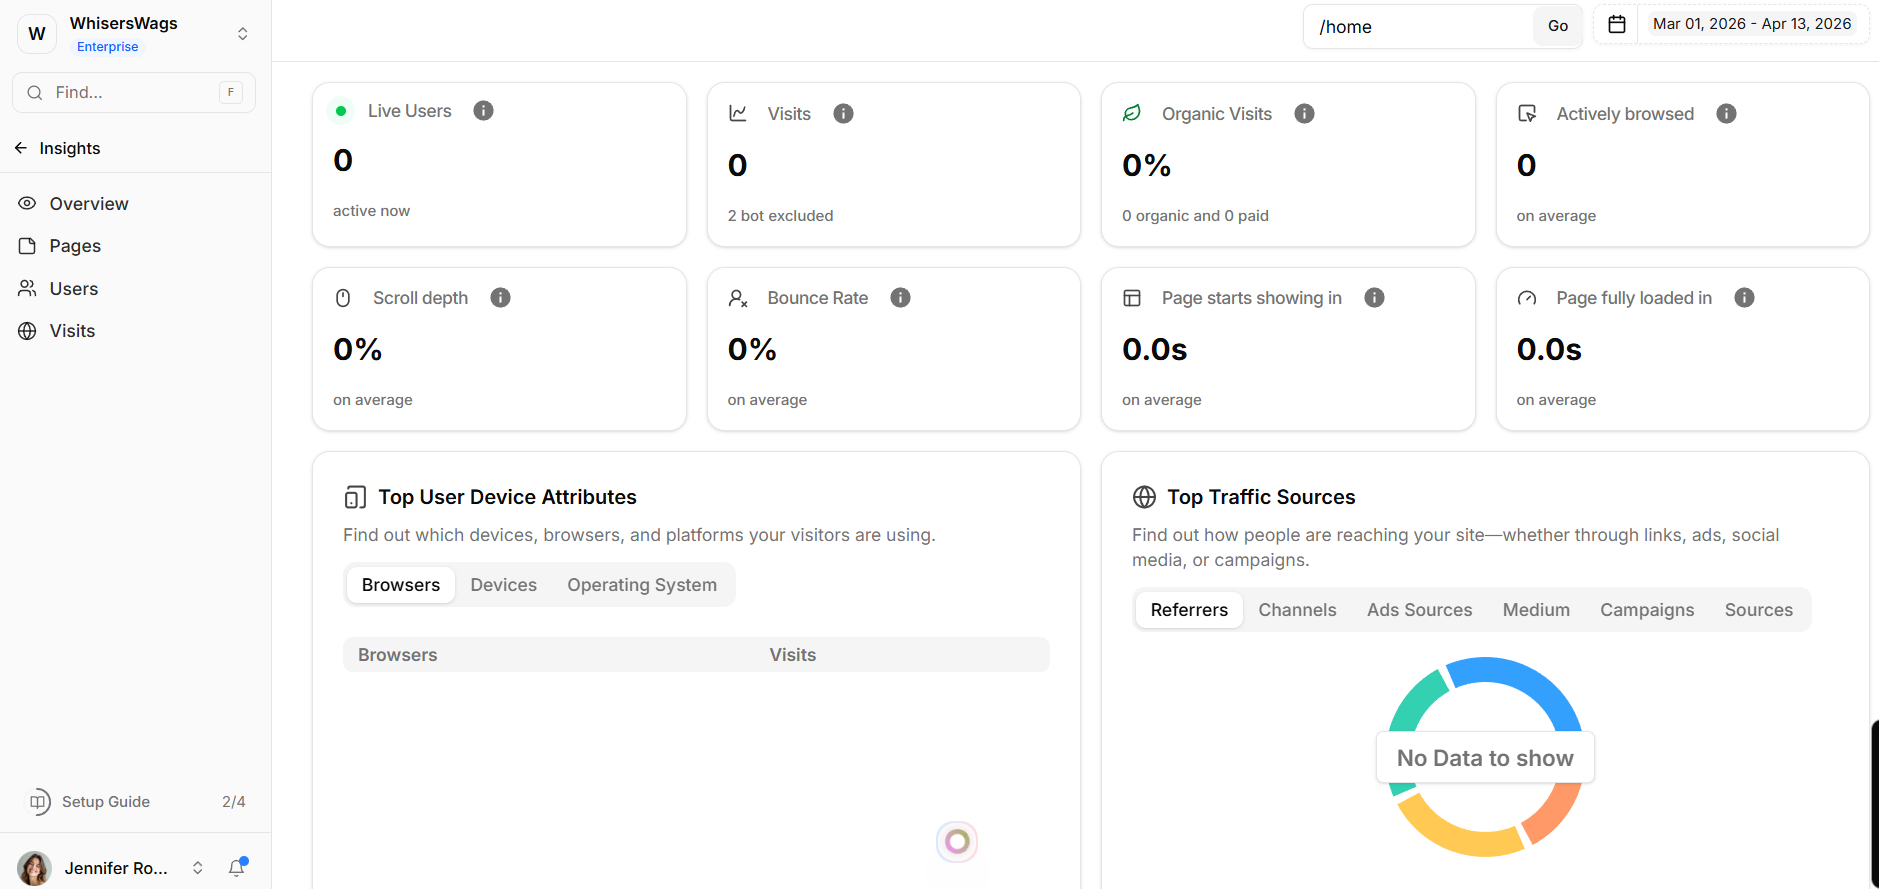
Visits: Your true total sessions. Bot traffic is rigorously excluded from this number (though the bot count is quietly displayed separately for context).
Organic Visits: The percentage of traffic arriving via organic search sources, displaying a clean organic vs paid split.
Pages per Visit: The average number of unique pages a user views during a single session (bounced sessions are intentionally excluded from this average to prevent skewed data).
Actively Browsed: Tracks real user engagement time by intelligently ignoring idle or inactive periods.
Scroll Depth: The average percentage of the page your visitors scroll through before leaving.
Bounce Rate: Calculates single-page sessions where the user departed within 10 seconds. (Note: The directional trend indicator is cleverly inverted, as a lower bounce percentage is a positive win!)
Page Load Time: Tracks the critical performance health of your infrastructure natively, measuring precise
window.onloadand First Contentful Paint metrics in seconds.Live Users: A dedicated, pulsing real-time card confirming exactly how many visitors are actively browsing your site right now.
Data Visualization Widgets
The dashboard includes interactive widgets for deeper analysis across trends, content, and user demographics.
1. Trend & Journey Widgets
AI Insights (Levo Intelligence)
Automatically analyzes data to highlight key patterns and anomalies
Insight Categories
Filter insights by:
Growth
Engagement
Opportunities
Risks
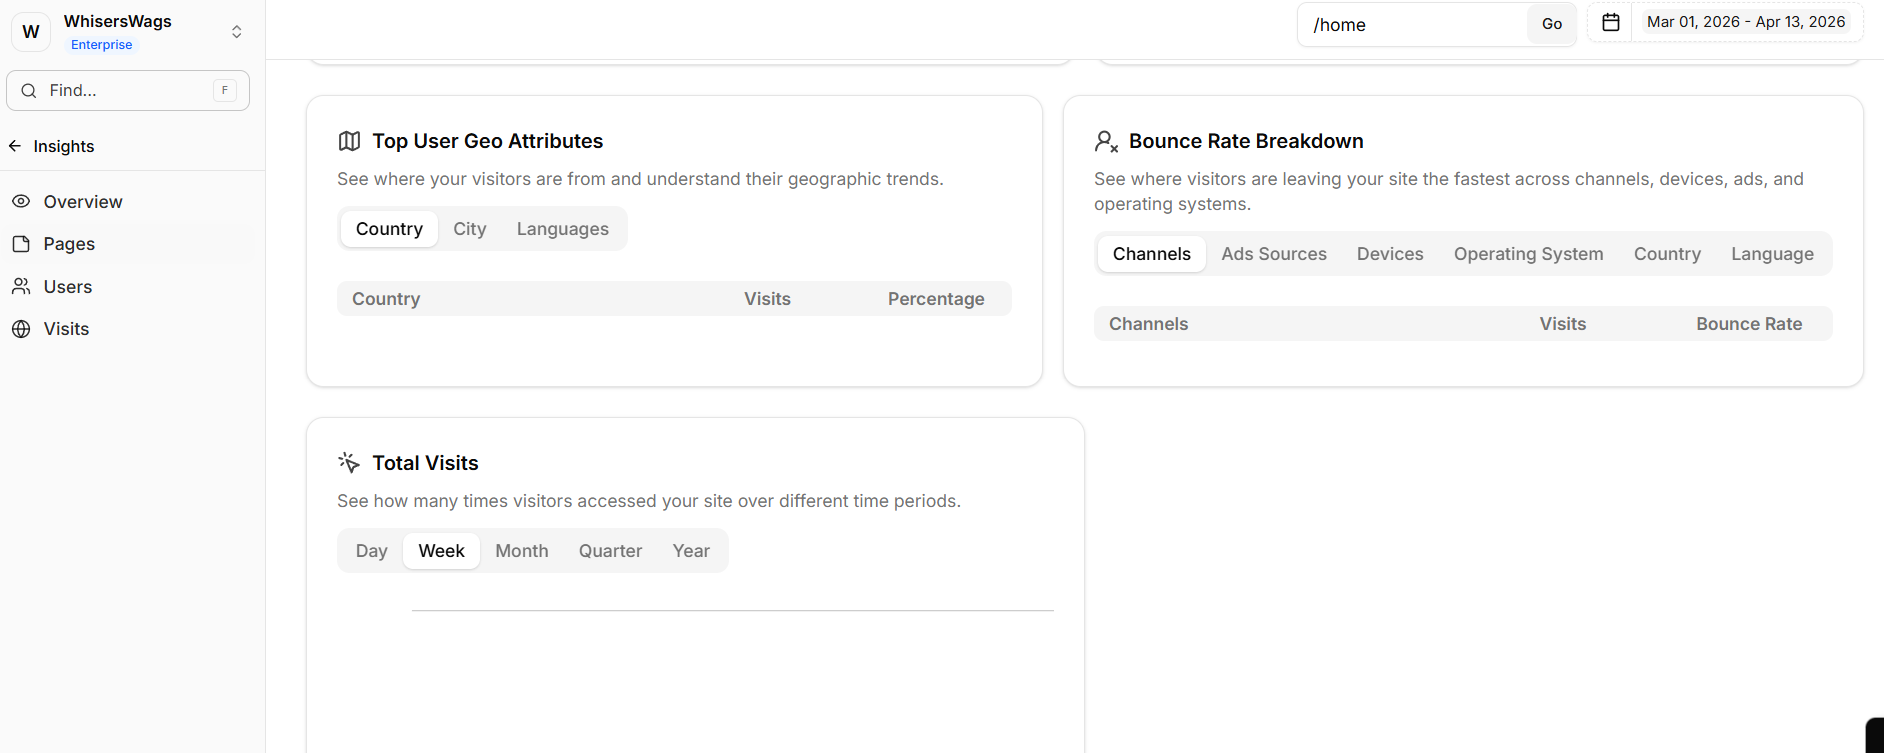
Total Visits Over Time
Displays traffic trends over selected periods
Breaks down traffic by source
User Growth
Compares new and returning users
Helps measure retention and long-term engagement
2. Content & Source Widgets
Popular Pages
Lists top-performing pages by visit count
Clicking a page filters the dashboard
Traffic Source
Shows where visitors originate from
Includes:
Referrers
Channels
Ad sources
UTM parameters
3. Demographic Widgets
Geographic Distribution
Displays user locations by country or city
Includes language insights
Device Breakdown
Compares usage across:
Browsers
Devices (desktop, mobile, tablet)
Operating systems
Bounce Rate by Dimension
Breaks down bounce rates by:
Channel
Device
Country
Language
Helps identify underperforming segments