Page-Level Analytics
Table of Contents
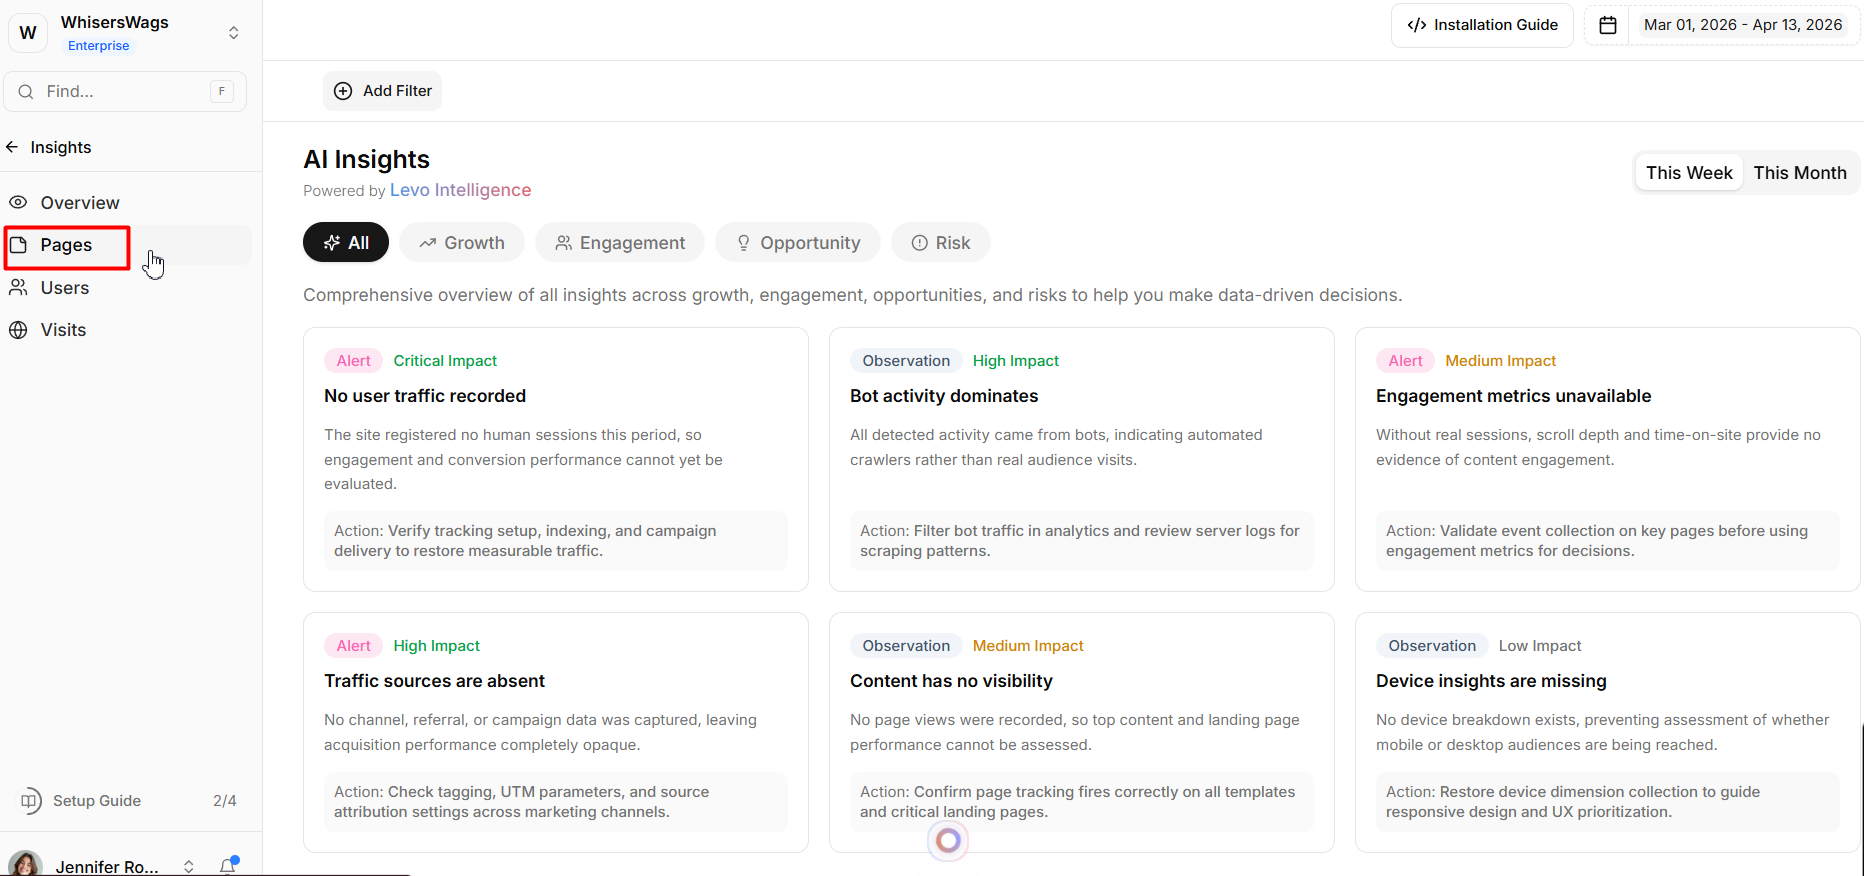
While the main Insights dashboard offers a high-level overview of your workspace, the Pages tab functions like a high-resolution microscope. It isolates performance data down to a single URL, enabling precise, in-depth content analysis.
Selecting a Target Page
The Page Selector
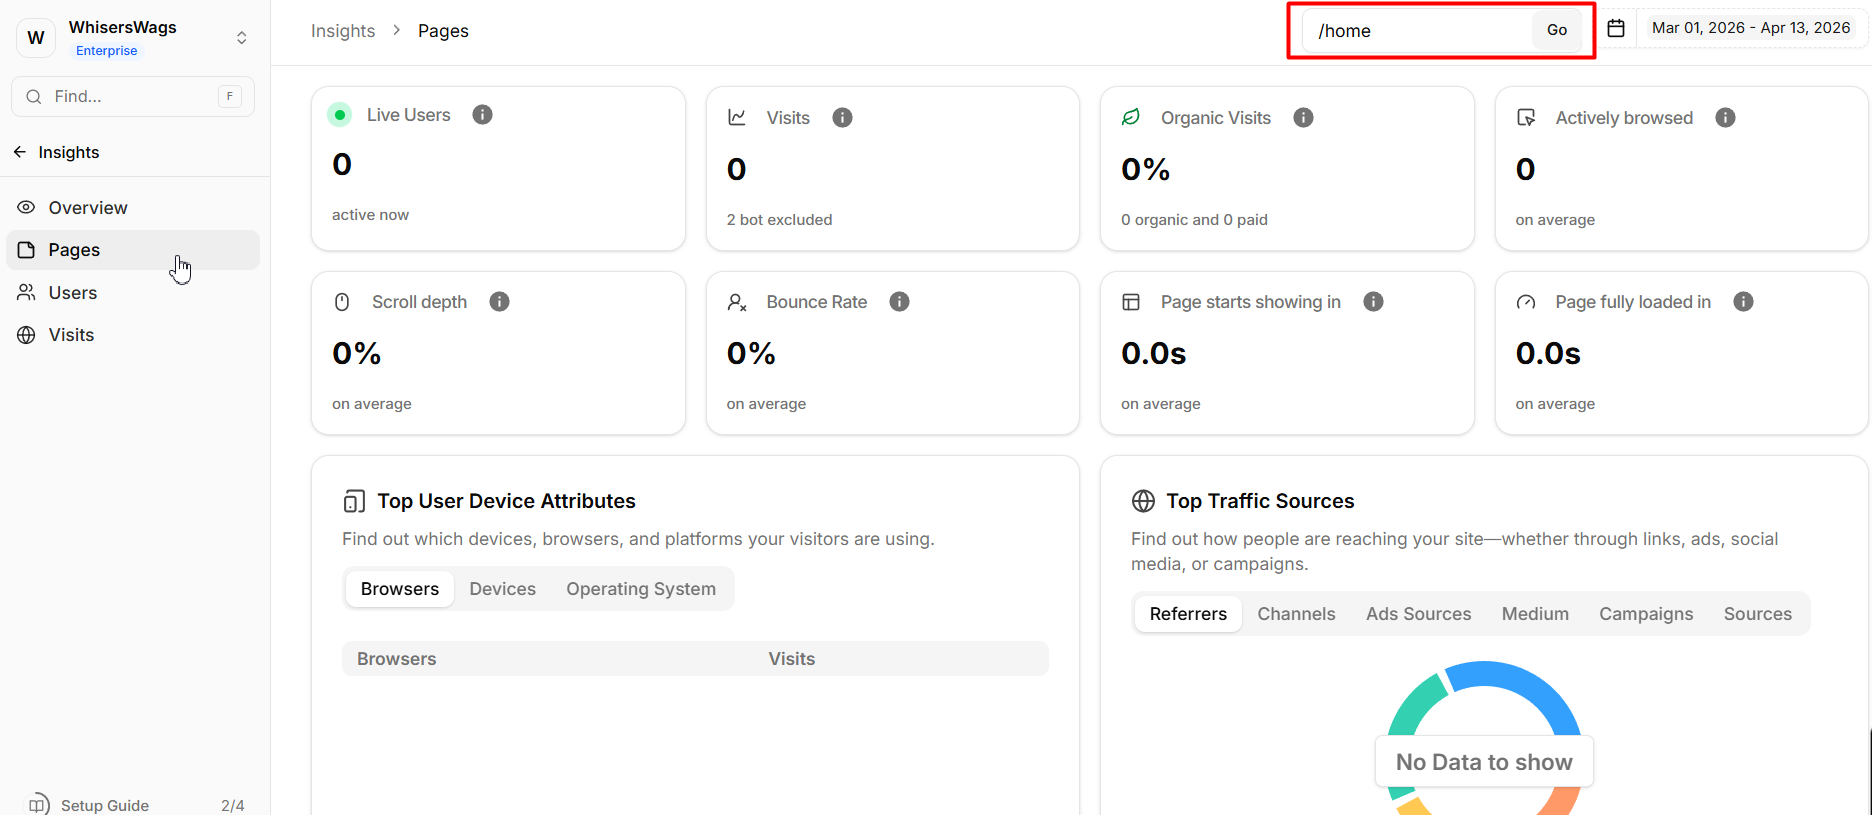
Use the dropdown in the top navigation bar to select a specific URL. Once selected, the entire dashboard dynamically updates to reflect metrics for that page alone—providing a true, isolated view of its performance.
Quick Pivoting
You can jump into page-level analysis instantly. From the Overview dashboard, simply click any URL in the Popular Pages table to open the Pages tab with that page pre-selected.
Tracked Metrics & Visualizations
The Pages dashboard uses the same powerful widget system as the main dashboard—but everything is scoped to your selected URL.
1. Core Page Statistics
These stat cards provide a snapshot of the page’s performance:
Visits & Organic Split
Total sessions for the page, with a breakdown of organic traffic.Pages per Visit
The average number of additional pages users visit after landing here.Engagement Tracking
Actively Browsed Time: Measures real engagement (excluding idle time).
Scroll Depth: Shows how far users scroll down the page.
Bounce & Load Times
Highlights performance issues such as slow load speeds or high early exit rates (e.g., within 10 seconds).
2. Diagnostic Widgets
These tools help you understand why a page performs the way it does:
Traffic Source
Identifies which channels, referrers, and UTM campaigns are driving traffic to this page.Geographic Distribution
Shows where your audience is coming from—by country or city.Device Breakdown
Analyzes performance across browsers, operating systems, and device types.Bounce Rate by Dimension
Breaks down bounce rate by segment (e.g., device, location), helping uncover hidden issues like high bounce rates on specific devices.Total Visits Over Time
A time-series chart showing traffic trends, helping you spot growth patterns or decline.